

Open Coach from the Products section of the dashboard navigation.
Choose the right Coach page
- Overview answers, “What happened across the team?”
- Agent Performance answers, “Who needs attention, and what should we coach?”
- Rubric Performance answers, “Which expected behaviors are being missed?”
- Call Review answers, “What happened on this specific call?”
- Recovery turns missed bookings into follow-up work when enabled.
- Reclassification corrects call types, reasons, tags, and supported attribution.
- Settings controls classification, call reasons, tags, rubrics, groups, alerts, reports, and metric colors.
- Enterprise Coach rolls supported Coach reporting and configuration across multiple teams.

Coach tabs vary with the team's enabled features and the signed-in member's permissions.
Start with a consistent review window
- Set the date range before reading any metric.
- Open Filters and narrow the population you want to evaluate.
- Read the metric cards and their comparison period.
- Use the chart, unbooked reasons, failed rubric items, and breakdowns to form a hypothesis.
- Open the underlying calls before changing a rubric, script, call reason, or agent process.
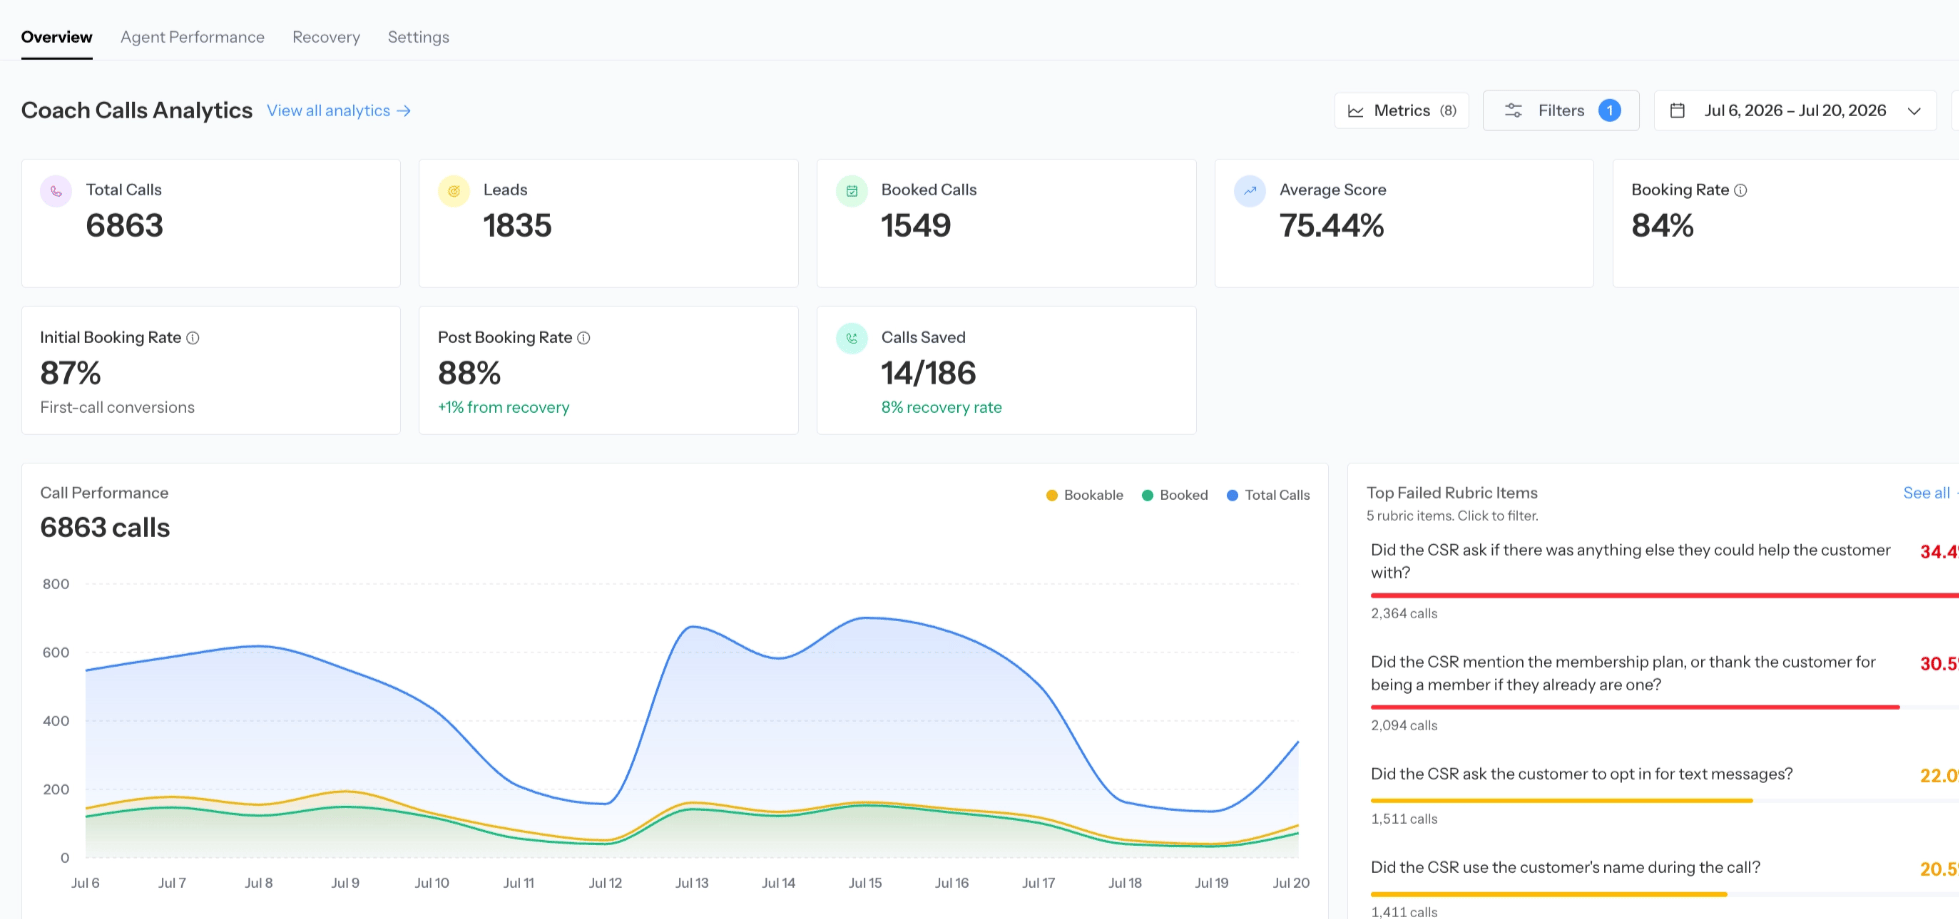
The Overview combines team metrics, charts, coaching signals, and call drill-downs.

Set the date range and filters before interpreting the page.
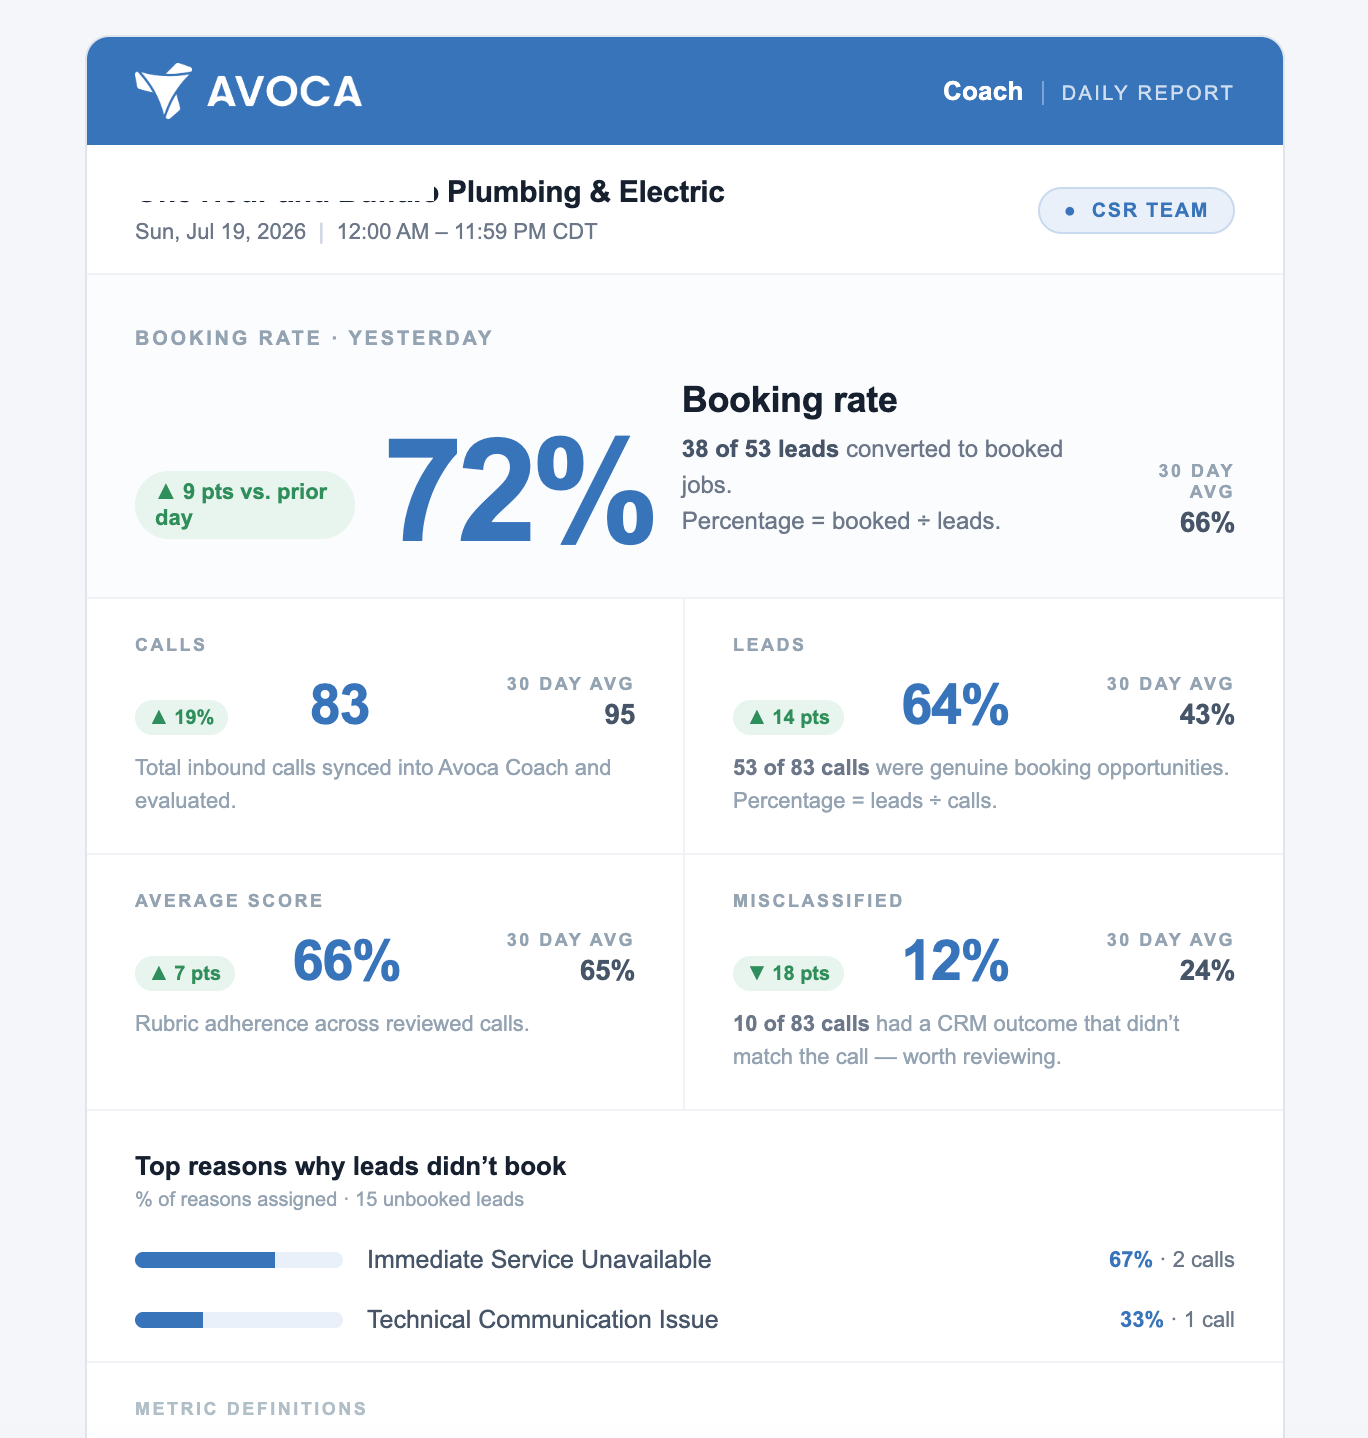
A repeatable morning review keeps the team focused on the same population and next actions.
Read the core metrics
The metrics-led Overview can include:- Total Calls: calls in the selected range and filter set
- Leads: calls Coach classified as genuine booking opportunities
- Booked Calls: leads that resulted in a confirmed booking
- Booking Rate: booked calls divided by leads
- Average Score: average score across calls evaluated with an applicable Coach rubric
- Average Wait Time and Average Handling Time
- Short Abandoned and Long Abandoned calls
- Average CSAT and Average FCR
- Initial Booking Rate, Post Booking Rate, and Calls Saved
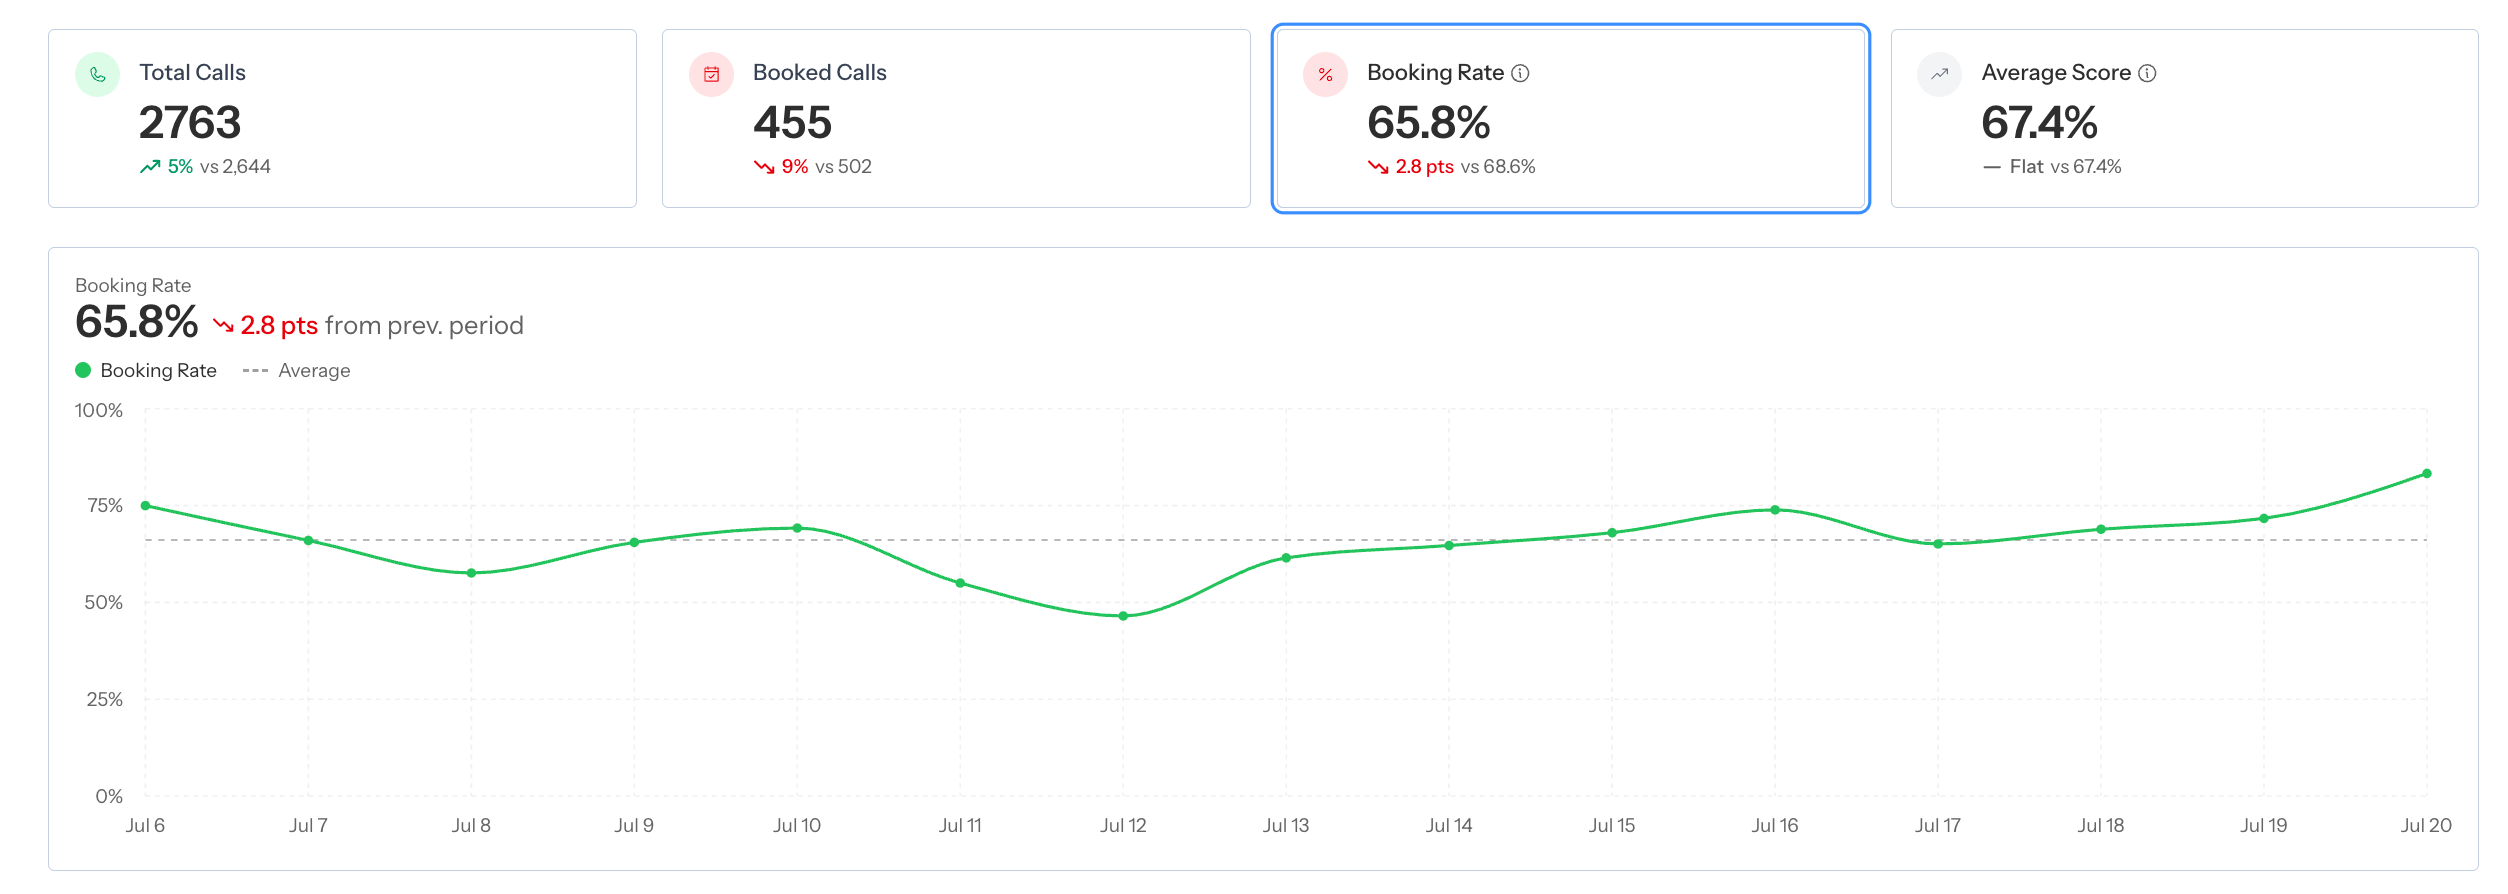
Metric cards reflect the current date range and active filters.
Booking Rate and ST Booking Rate
Where both metrics appear, they use different classification sources:- Booking Rate uses Avoca’s AI determination of leads and booked outcomes.
- ST Booking Rate uses ServiceTitan call-type classification.
Overall and Agent-by-agent booking rate
When Avoca transfers a caller to one of your agents, Coach grades each leg of the call separately. A booking opportunity that Avoca hands off can therefore appear twice: once on Avoca’s leg and once on your agent’s. When booking-rate views are enabled for your team, tabs above the metric cards on the Overview and Agent Performance pages choose how to count it:- Overall booking rate leaves out Avoca legs that transferred the caller without booking. Each opportunity counts once, for the agent who received it. If Avoca transfers two bookable callers and your agent books both, Avoca shows 0 of 0 and your agent shows 2 of 2.
- Agent-by-agent booking rate keeps every leg, so a bookable call Avoca transferred counts against Avoca. In the same example, Avoca shows 0 of 2 and your agent shows 2 of 2.
is_transferred_out_leg field on each call from GET /api/coach: drop the calls where it is true for Overall, or keep every call for Agent-by-agent. See Authentication to set up an API key.
Average Score
Average Score includes evaluated calls whose rubric applies. Calls with no evaluation or calls excluded from grading do not contribute in the same way as scored calls. If a team uses multiple rubrics, filter to a rubric before comparing performance for a specific call type. A blended average across dissimilar rubrics can hide a meaningful coaching problem.Use filters deliberately
Available filters vary by team, but can include:- Agents and agent groups
- Inbound or outbound direction
- Business-hours status
- Booking and lead status
- Tags and campaigns
- Current or suggested call type
- Current or suggested call reason
- ServiceTitan call memo presence
- Coaching-score range
- Survey results
- Rubrics and failed rubric items
- Customer sentiment
- Short, inactive, unprocessed, misclassified, or reclassified calls
- Days of the week to exclude
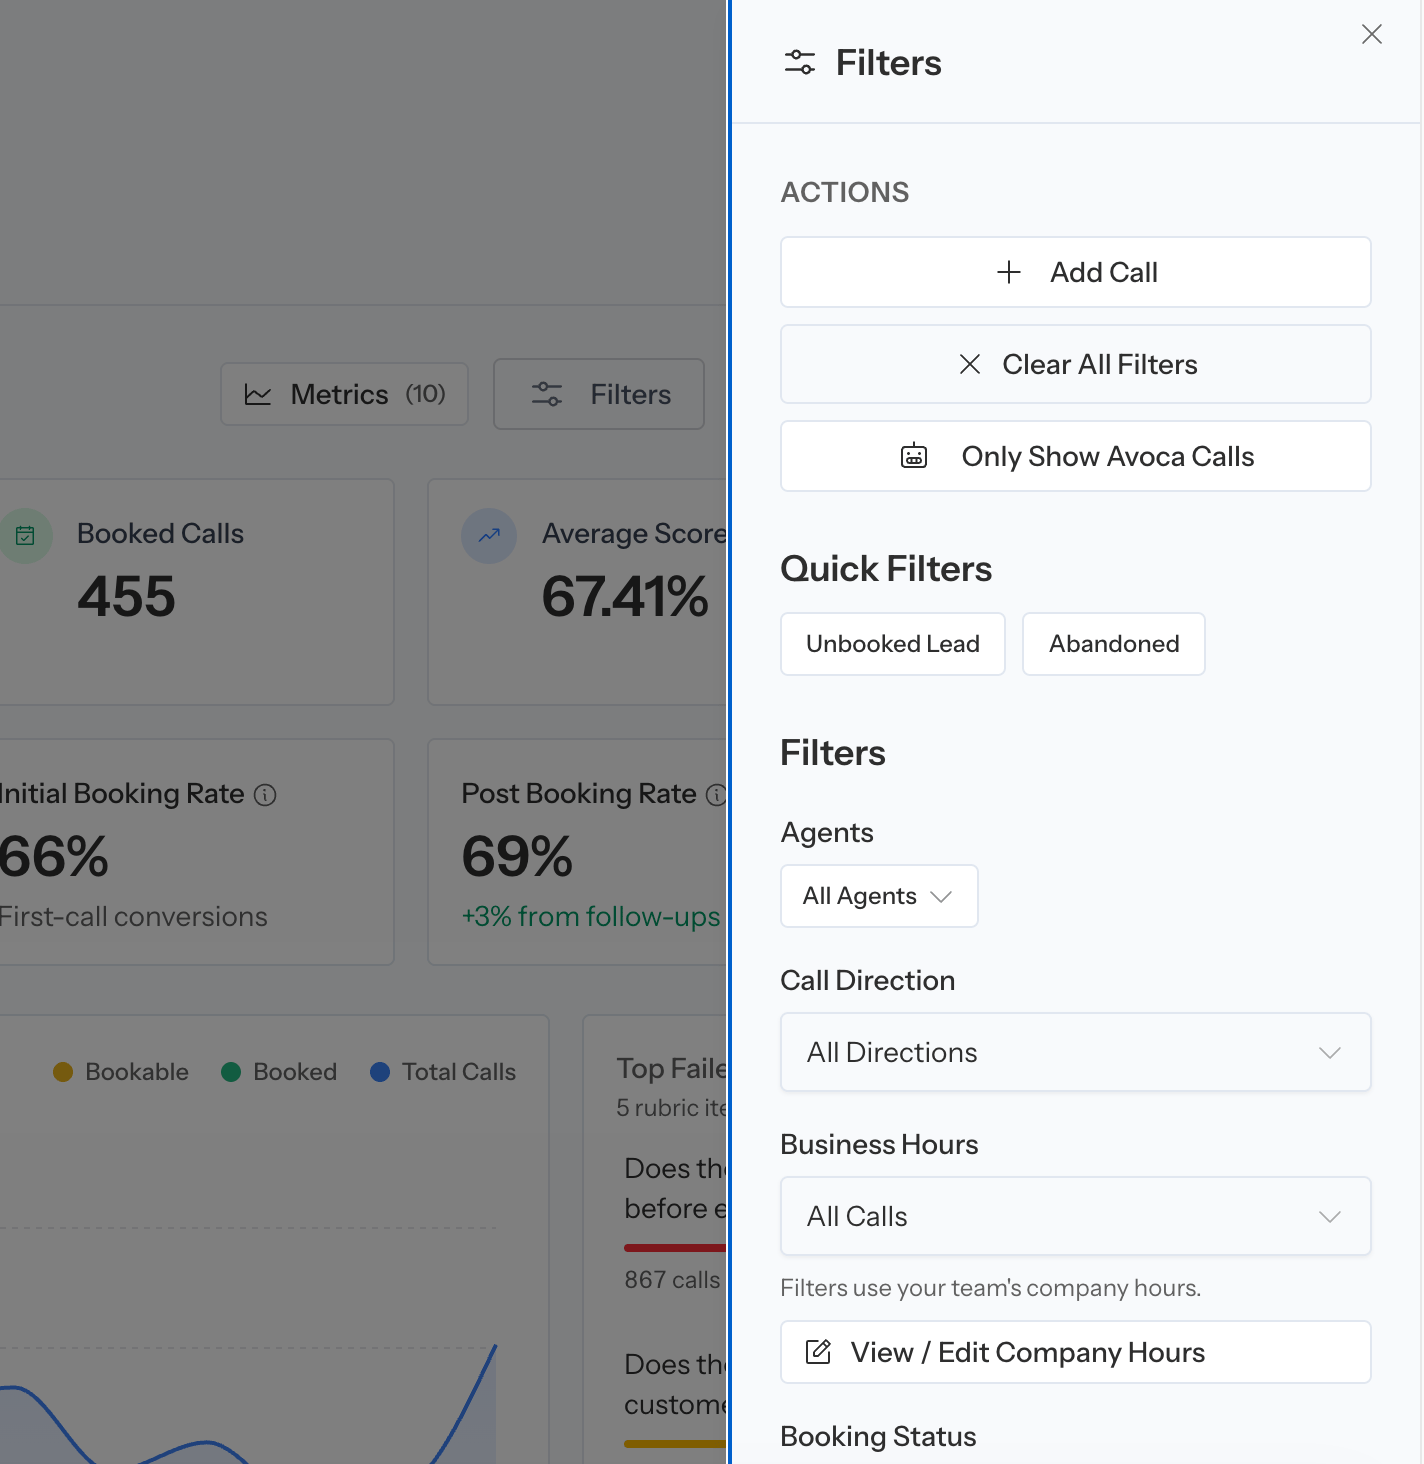
Use the filter drawer to define the population behind every metric and chart.
Useful filter recipes
Combine filters to answer one operational question at a time. For example, narrow to calls Coach believes were misclassified, or to one agent and failed rubric item before a coaching review.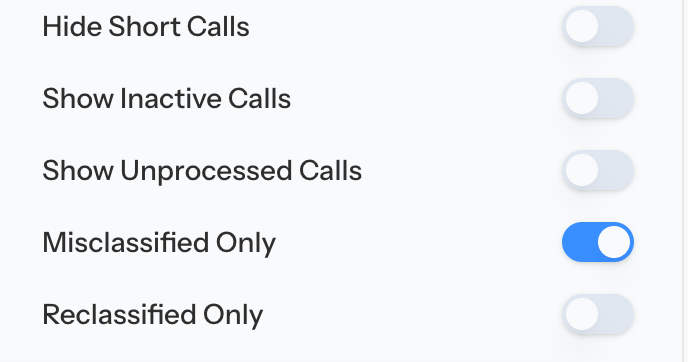
A misclassification filter isolates calls where Coach and the current disposition disagree.
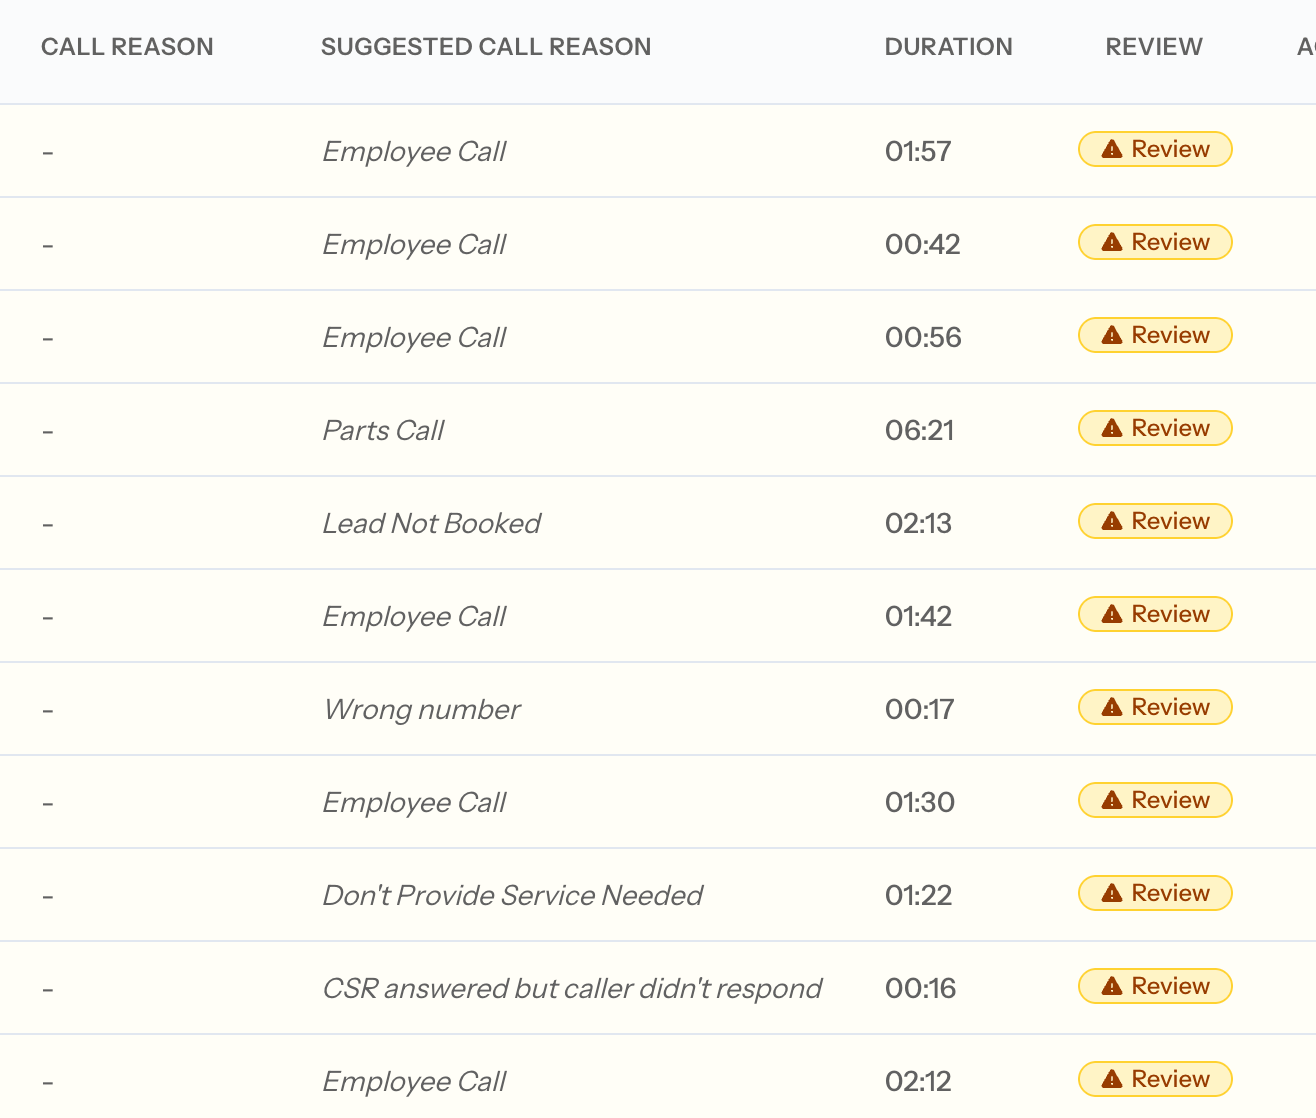
Combine agent, rubric, and outcome filters to prepare a focused coaching session.
Analyze the Overview
Call Performance
The performance chart shows how selected call metrics change over the review period. Use it to find when a change began, then narrow the range and inspect calls from the affected days.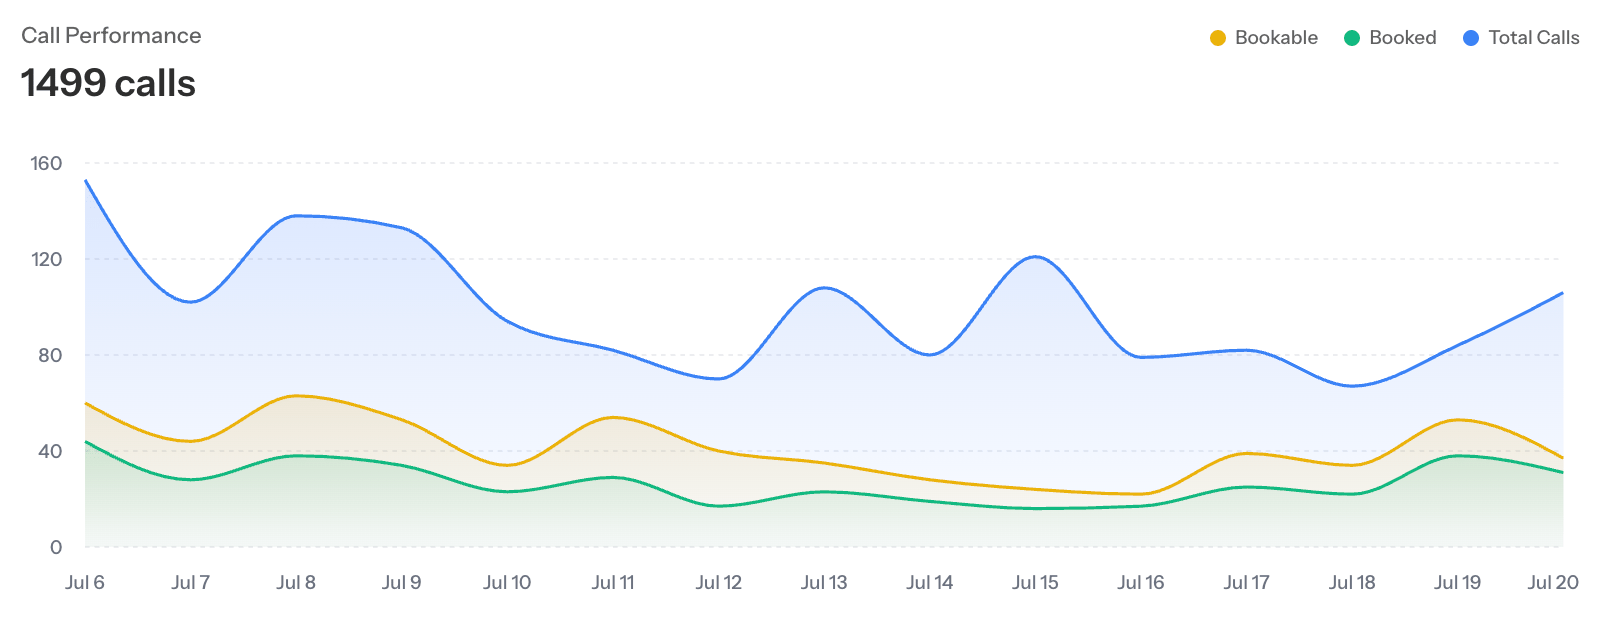
Call Performance plots the selected call populations over time.
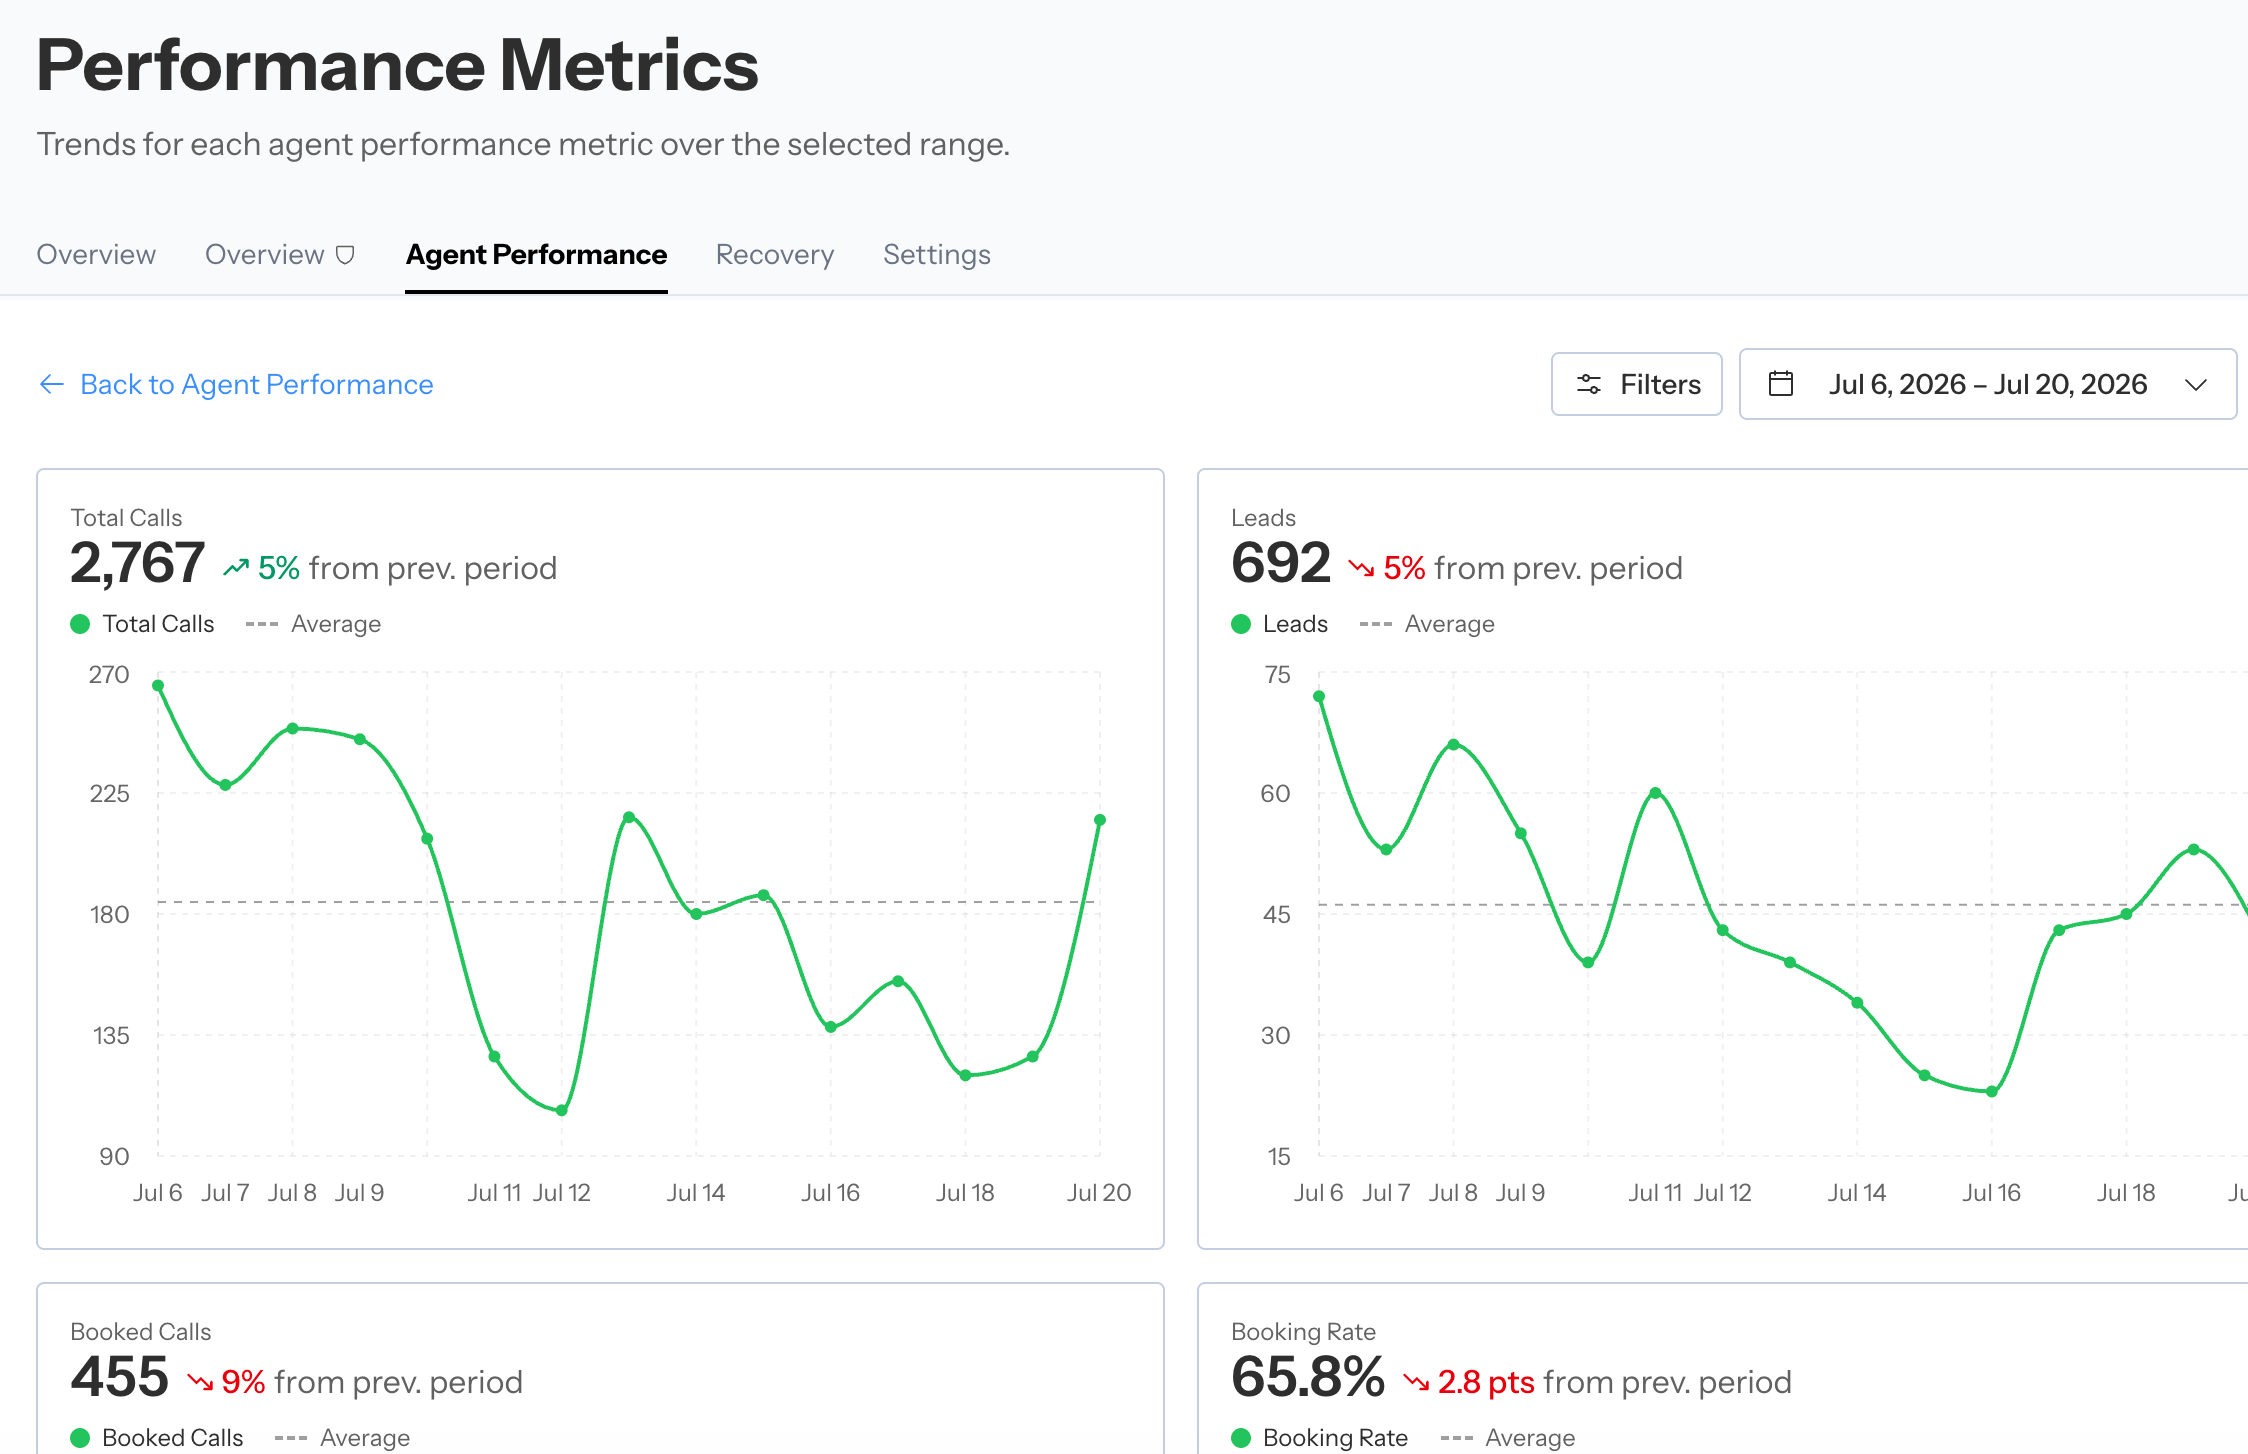
Related analytics pages preserve the reporting context for a deeper trend review.
Top Unbooked Reasons
This section summarizes why leads did not book. Some teams can switch between reason and source views.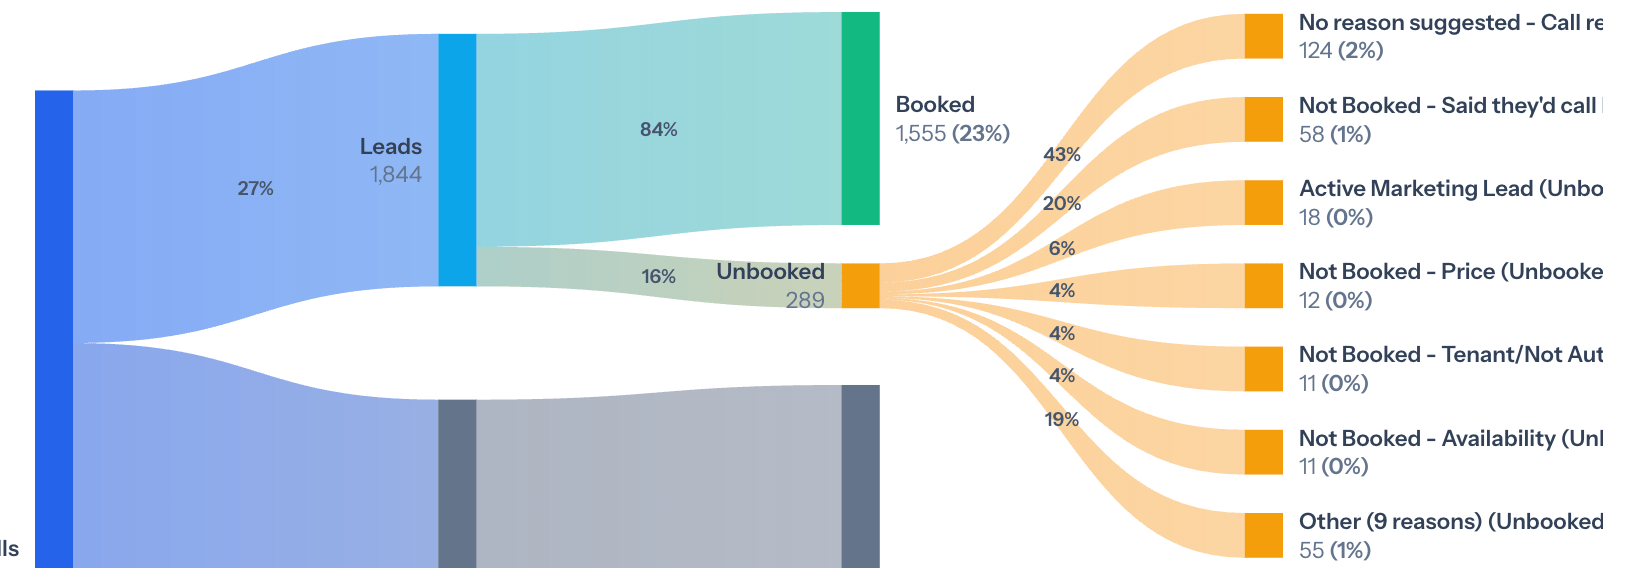
Top Unbooked Reasons ranks the most common explanations in the selected population.
- Select a prominent reason.
- Review several calls from different agents.
- Separate agent behavior from availability, pricing, service area, policy, or classification issues.
- Change the appropriate process only after the pattern is verified.
Top Failed Rubric Items
This section ranks the rubric criteria most often marked No. Select an item to filter the relevant calls, or open Rubric Performance for category-level success rates, prior-period change, coaching suggestions, and a full call drill-down.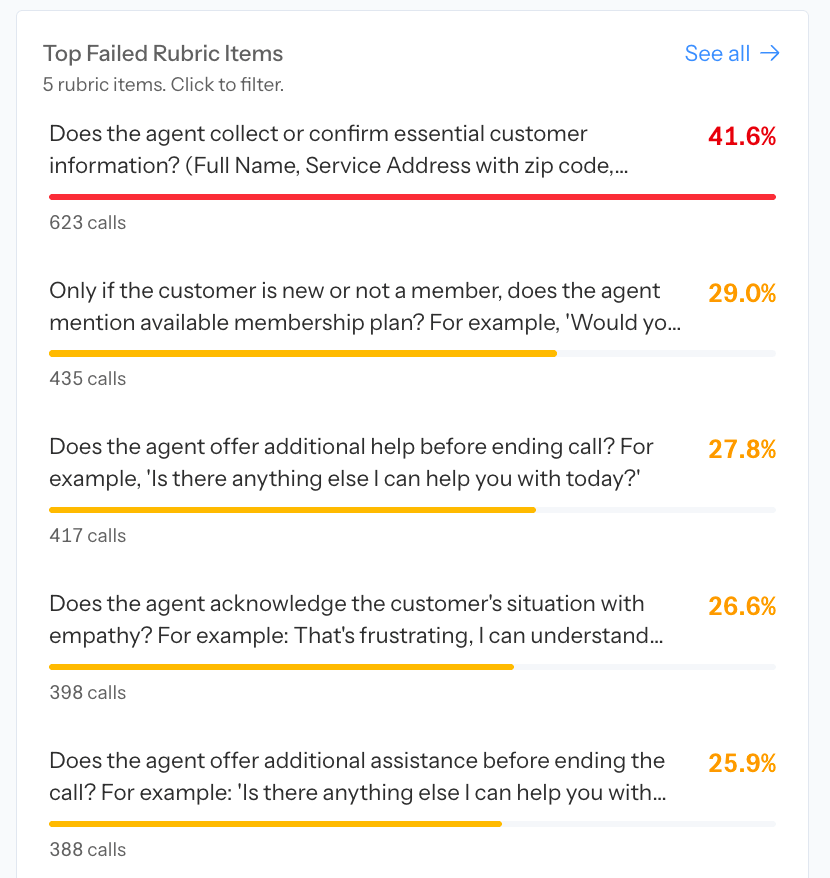
Top Failed Rubric Items highlights behaviors that most often missed the expected standard.
Call Flow visualization
When reclassification analytics are enabled on the call-list Overview, the call-flow visualization shows how calls move through qualification and booking outcomes. Use it to identify large transitions, then open the calls behind the flow before changing classification policy.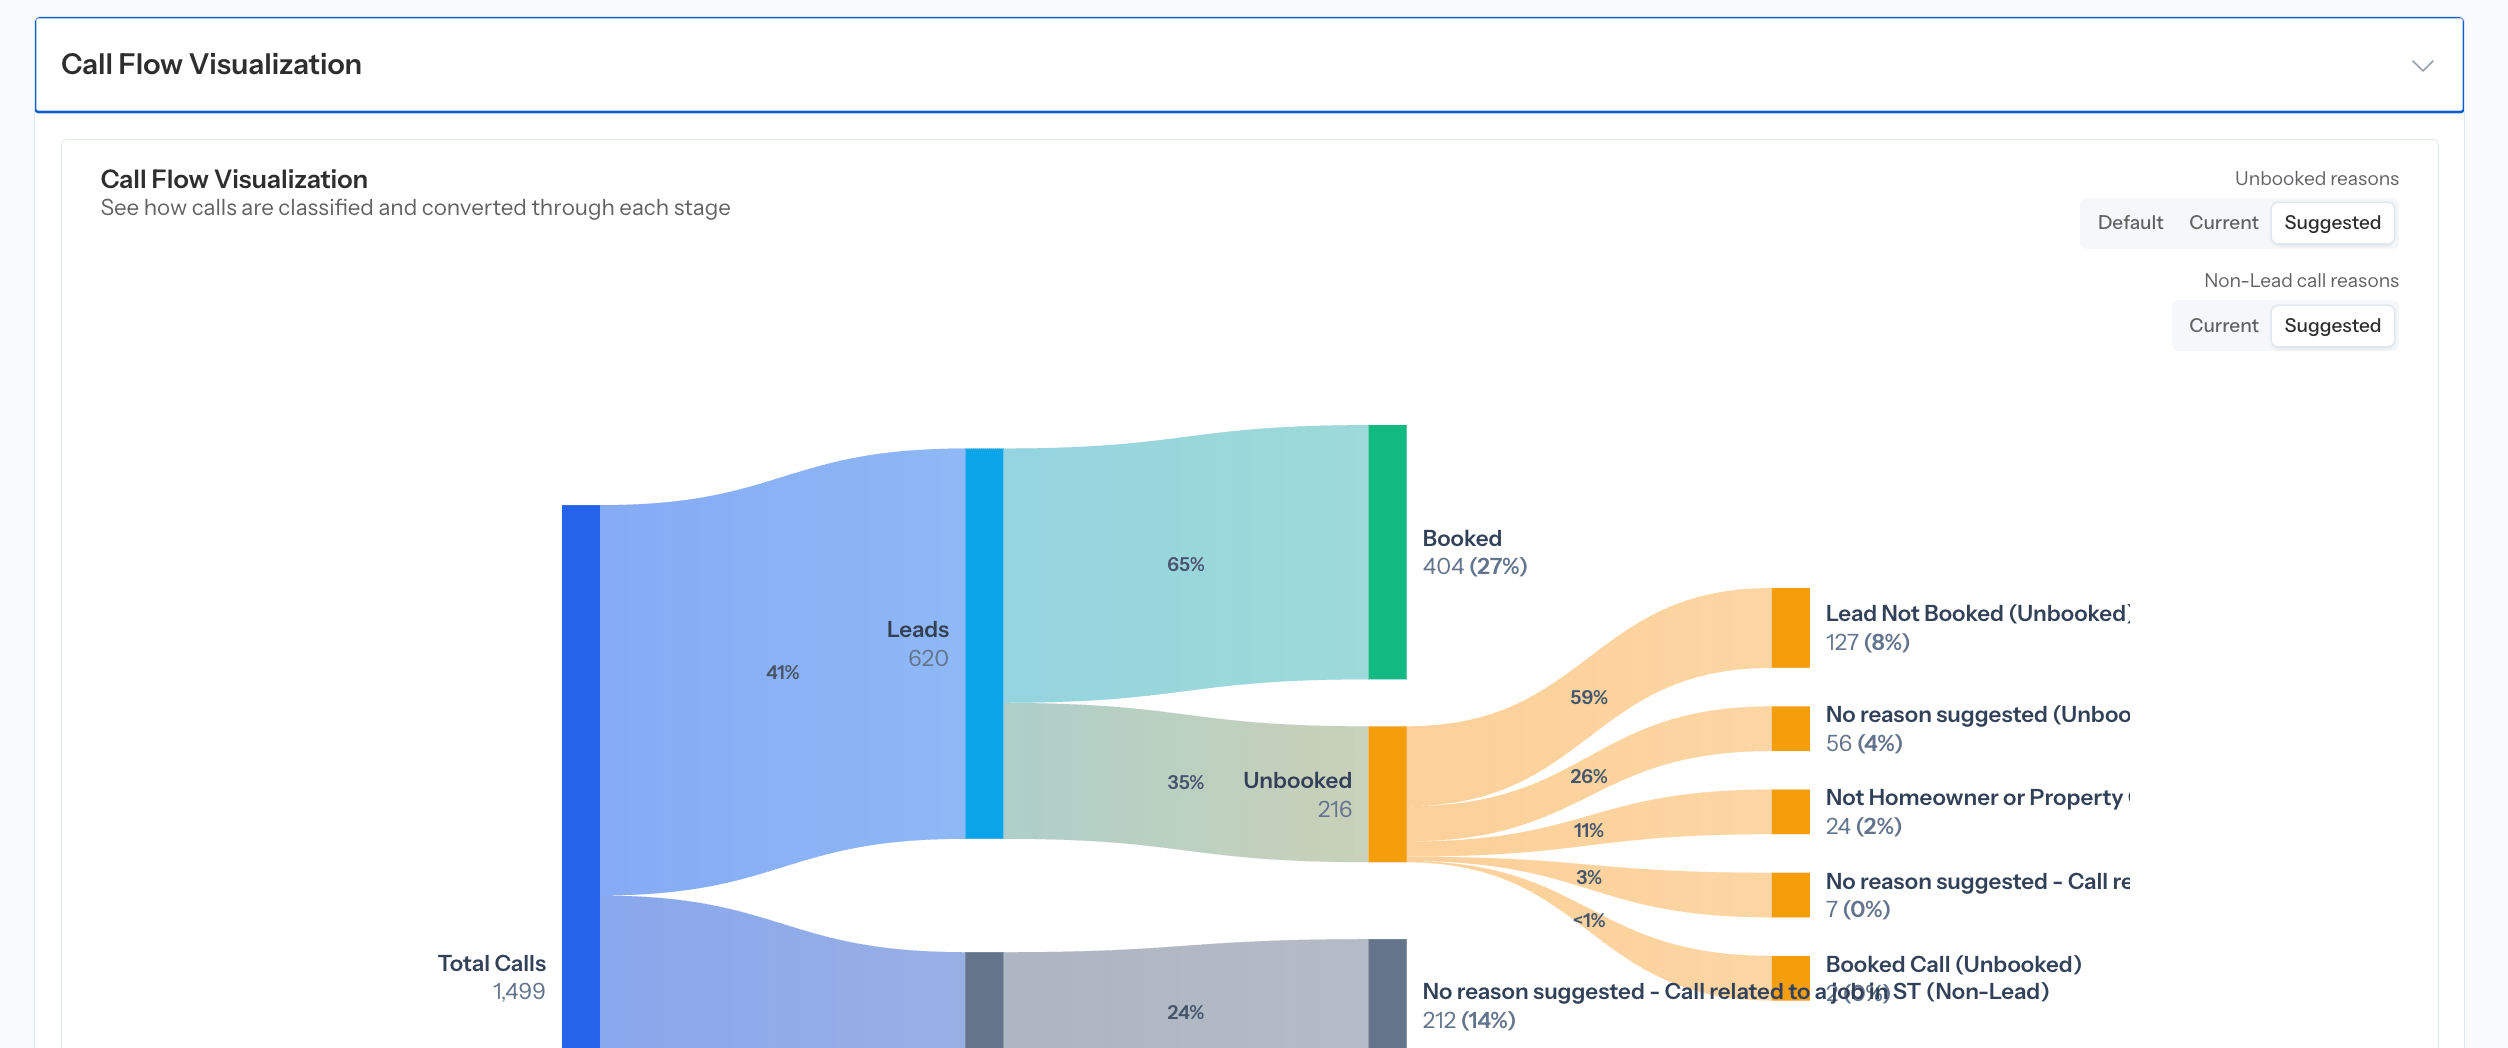
The call-flow visualization connects source dispositions with Coach qualification and booking outcomes.
Breakdowns
Breakdowns compare one metric across a dimension such as:- Tag
- Agent
- Lead status
- Booking status
- Call direction
- Suggested call type
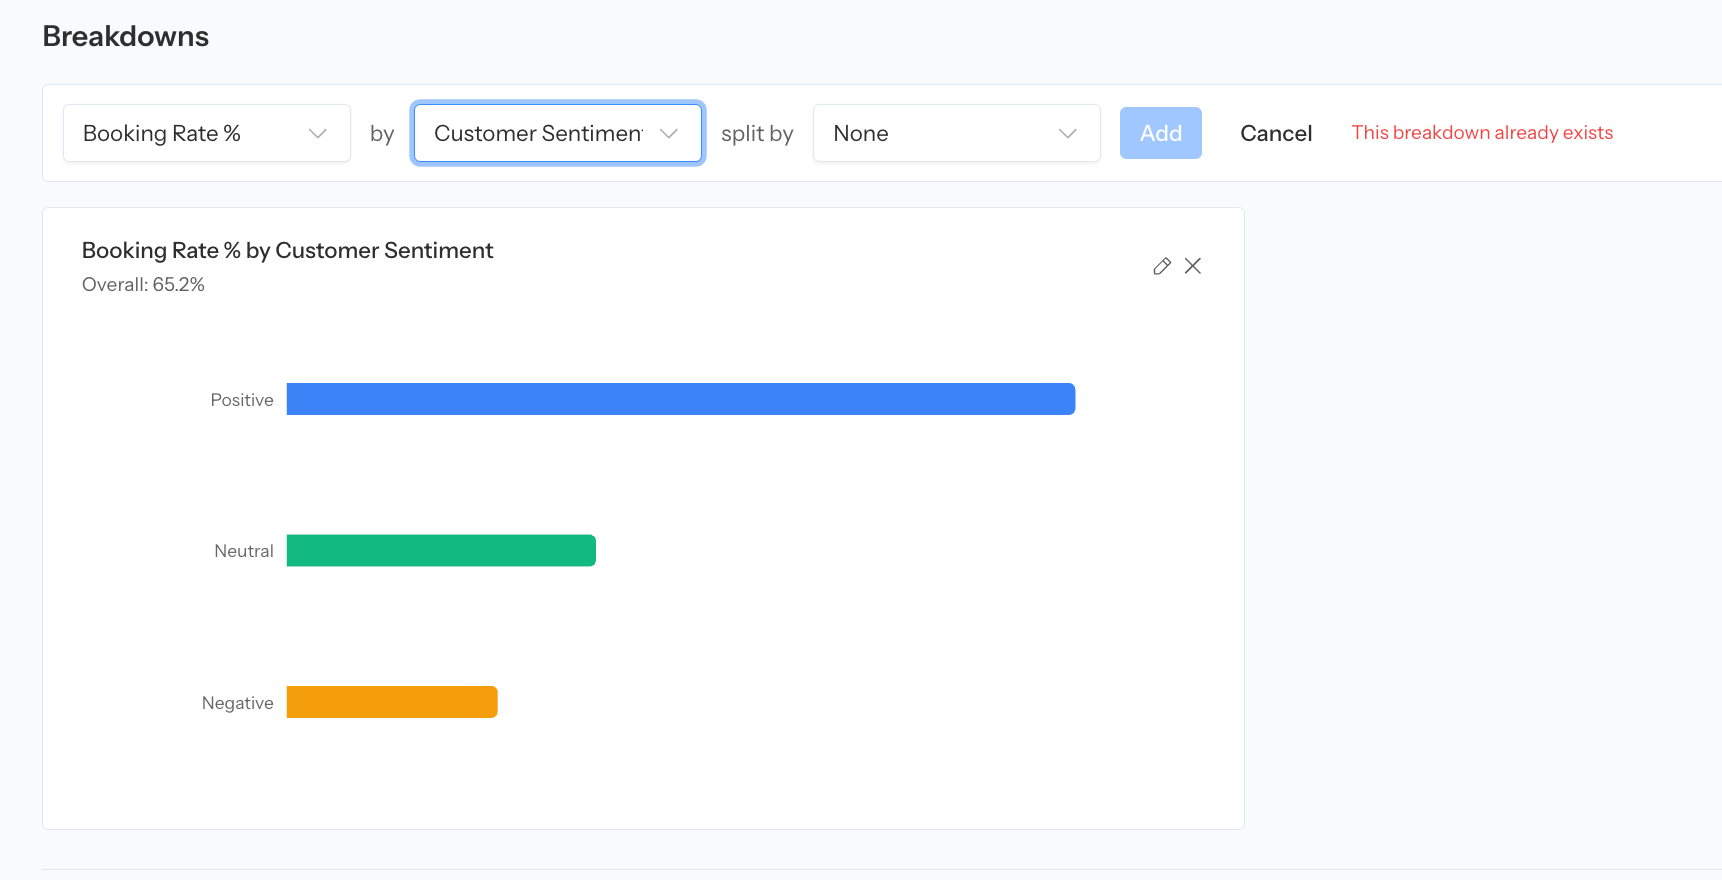
Breakdowns compare one selected metric across a dimension such as agent, direction, or tag.
If your Overview is a call list
Some teams use the legacy call-data Overview. It combines metric cards, charts, a configurable calls table, and operational review actions. You can typically:- Choose which metric cards are visible
- Show, hide, and reorder table columns
- Search, filter, sort, and export the current data
- Open a call in the review experience
- Select calls for available bulk actions
- Mark calls read or unread, archive calls, or refresh supported data
- Review call-flow, unbooked-reason, rubric, and breakdown sections when enabled
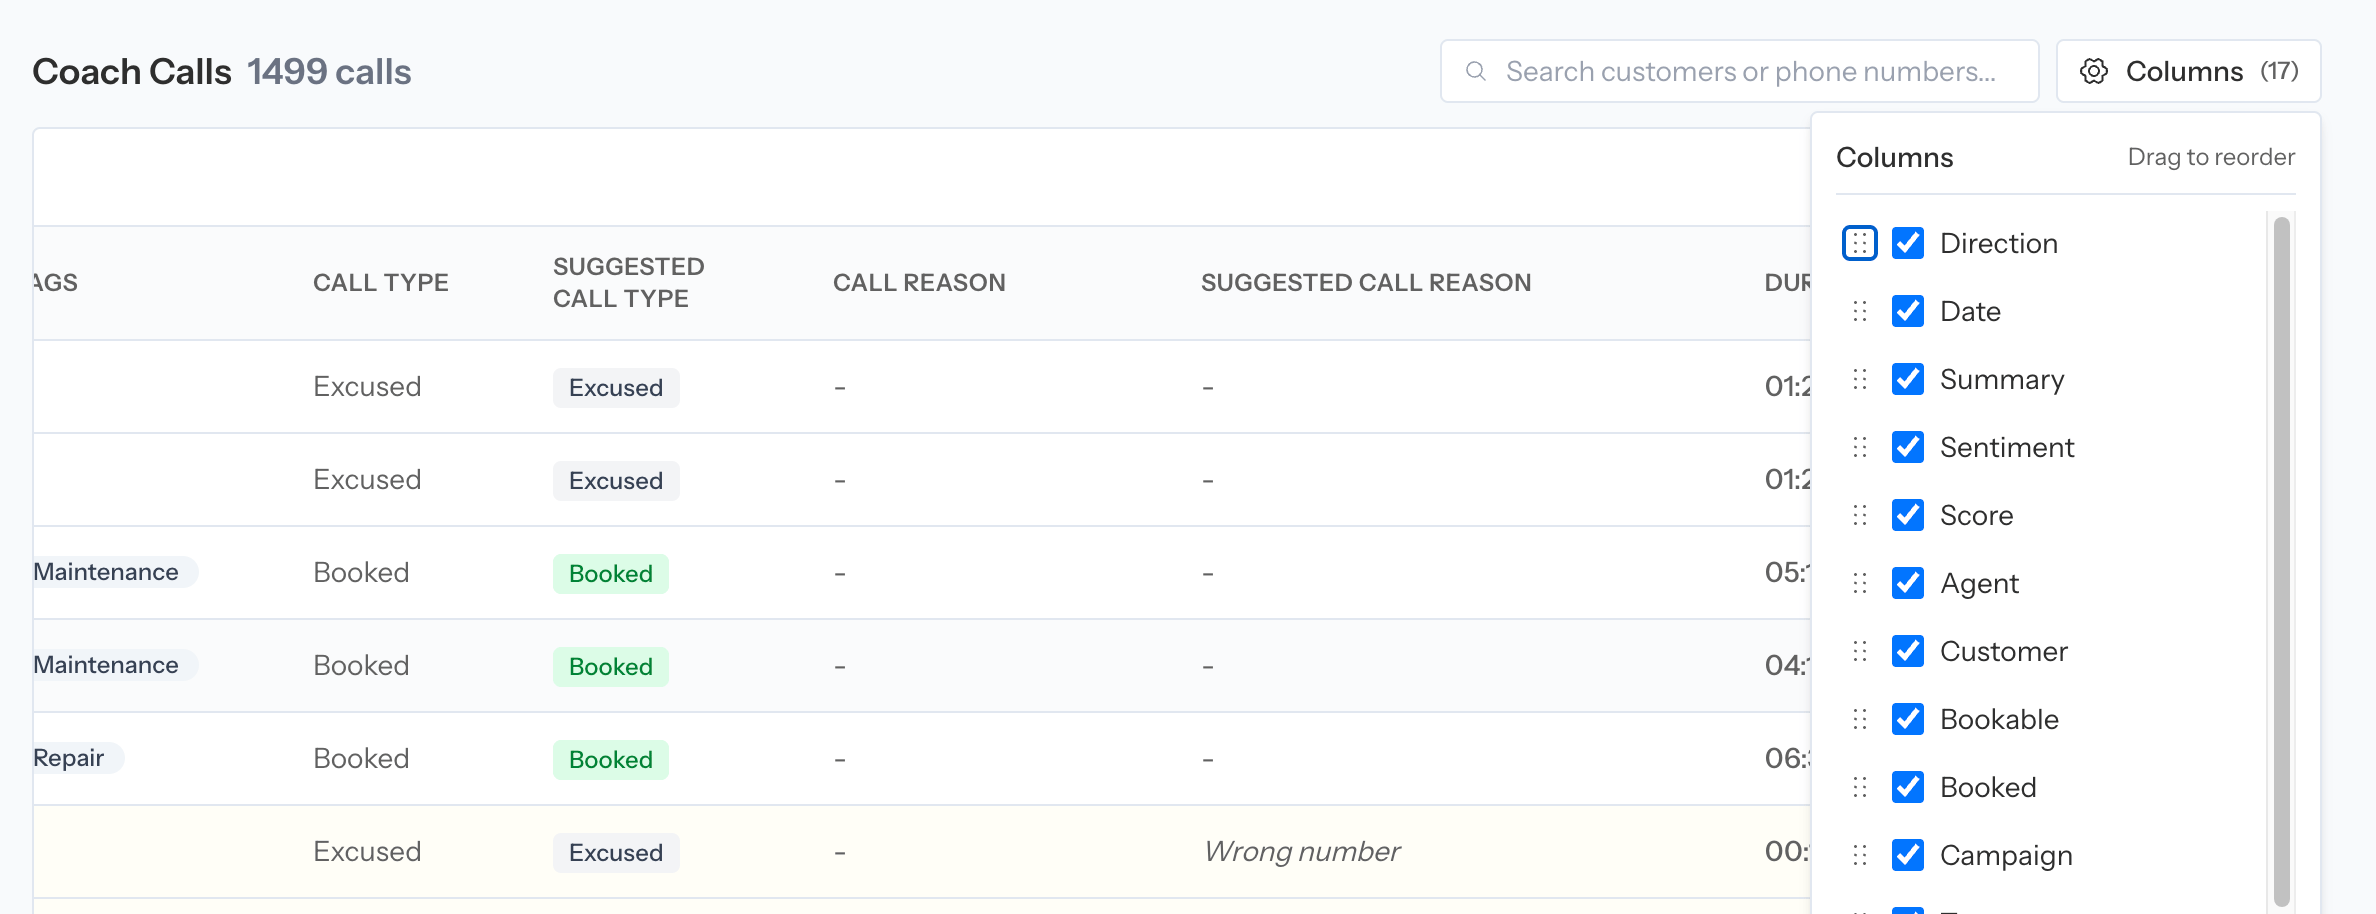
The call-list Overview combines analytics with a configurable operational calls table.
From signal to action
Use this sequence to avoid optimizing around a misleading aggregate:- Find the signal. Start with a metric, unbooked reason, failed rubric item, group, or agent.
- Confirm the population. Check the date range and filters.
- Inspect calls. Listen to a representative sample and read the transcript and coaching evidence.
- Identify the cause. Decide whether it is a coaching, staffing, availability, policy, rubric, or classification issue.
- Make the smallest change. Coach the agent, update a setting, or correct the call.
- Measure again. Compare the same metric and population after enough new calls have been evaluated.